10MW Wind Turbine Optimization Example
Introduction
At WindFlow Engineering we thrive to share our knowledge and train new generation of engineers. So far we have successfully cooperated with Łódź University of Technology. One such example is involvement of our employee PhD. Vladimir Leble in co-supervision of Engineering Diploma Thesis of B.Eng. Jeremi Przewoźny. Subject of the thesis is “Performance analysis and optimization of wind turbine behaviour for various wind conditions using the Blade Element Momentum Method”. We are proud that with our support the work of B.Eng. Jeremi Przewoźny was distinguished with several awards:
- 1-st pace in the Competition for the Best Graduates of the Faculty of Mechanical Engineering at the Łódź University of Technology.
- 5-th place in the Veolia competition (for works related to new technologies in the energy industry).
- 27-th place in the XXI edition of the National Competition for the Diploma and Award of the President of SIMP.
Award diplomas for wind turbine optimization thesis of Jeremi Przewoźny.
The thesis can be freely accessed with the permission of B.Eng. Jeremi Przewoźny.
Summary
The thesis started with implementing BEM based solver with the guidance of WindFlow specialists. Next, the solver was validated against known solutions from DTU for the open source design of 10MW RWT wind turbine. An iterative optimizer was then implemented to tune the design for local wind conditions in Polish offshore region near Hel peninsula. The optimizer aims to increase power production by tuning pitch schedule for the controller, or in other words tuning the pitch-lambda curve. Overall increase of AEP after tuning is around 0.36% with respect to starting power output.
Test case conditions
While this procedure can be followed for a variety of different wind turbines, a test case of DTU 10MW Wind Turbine placed offshore close to Hel was chosen to be investigated. The most important parameters of this turbine are listed below:
- Rotor orientation: upwind with clockwise rotation (it means that it has the rotor facing the wind. This is the case for the vast majority of modern wind turbines)
- Cut in wind speed: 4 m/s (the wind speed at which the blades start rotating)
- Cut out wind speed: 25 m/s (the wind speed at which the turbine has to shut down to avoid damage)
- Rated wind speed: 11.4 m/s (the wind speed limit at which maximum power is generated - exceeding the rated wind speed will not generate additional power)
- Rated power: 10 MW
- Number of blades: 3
- Rotor diameter: 178.3 m
- Hub diameter: 5.6 m
- Hub height: 119.0 m
- Drivetrain: Medium speed, Multiple-Stage Gearbox
- Gearbox ratio: 50
- Minimum Rotor Speed: 6.0 rpm
- Maximum Rotor Speed: 9.6 rpm
- Rotor mass: 227.962 kg
- Nacelle mass: 446.036 kg
- Tower mass: 628.442 kg
Hel region was chosen due to its favourable wind conditions in Poland. In order to estimate the annual energy production of the wind turbine placed in this region the area surrounding Hel has been investigated in terms of average wind speed at the height of 100m. It resulted in conclusion that the wind speed with the biggest probability of occurring is 7 m/s. This means that the 10MW RWT will be mostly operating in below rated wind speed. In turn, this means that the power production is not controller limited, and local power increase in most probable regions of operation may be possible.
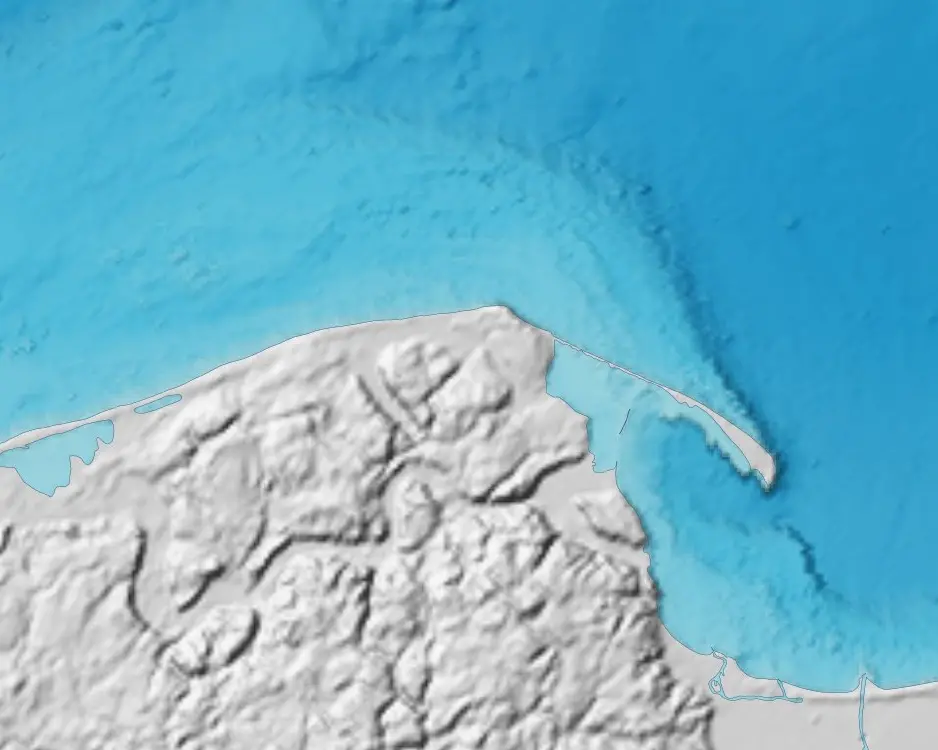
Water depth map
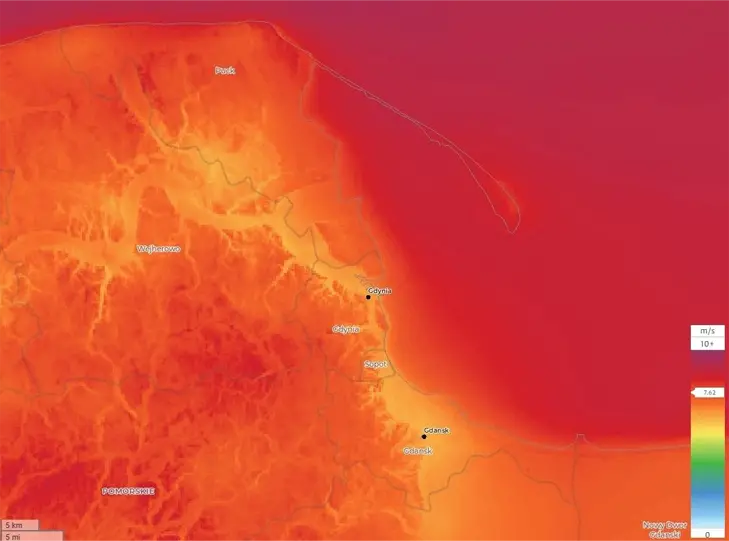
Wind speed map
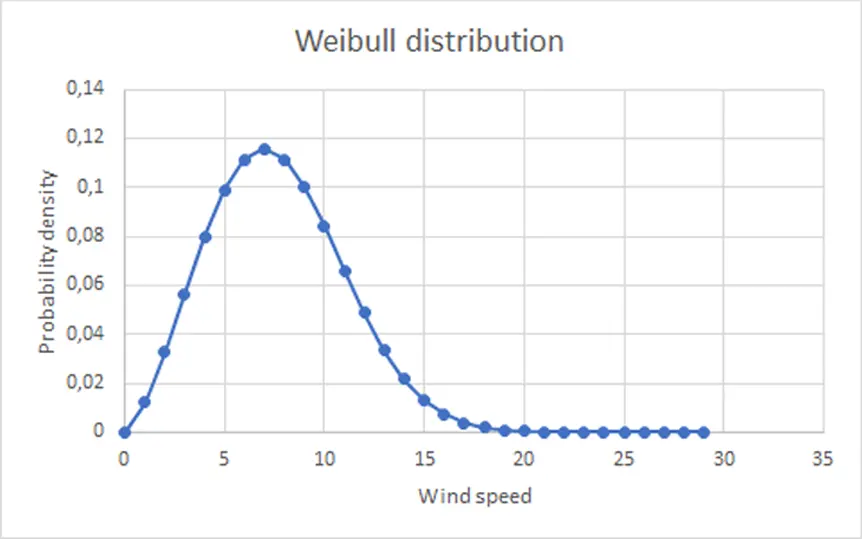
Weibull distribution
Methodology
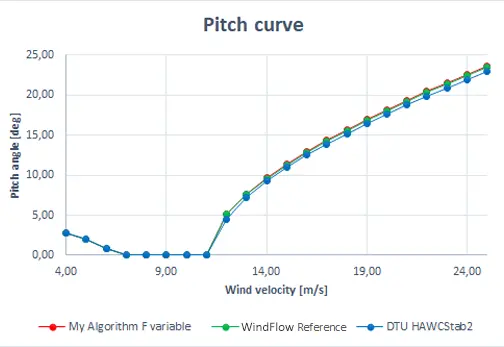
The steady BEM code was developed for purpose of this thesis. In order to be assured that the algorithm is working correctly a comparison has been conducted between the BEM algorithm and the data taken from two trusted sources used as a reference. Firstly an algorithm with constant tip-loss factor F = 1 was tested but as it can be noticed it provided results that were too high to be accepted. In the second order the algorithm with variable F was tested and it provided much more satisfactory results. The pitch curve obtained during those tests can therefore become a reliable baseline for planned optimizations.
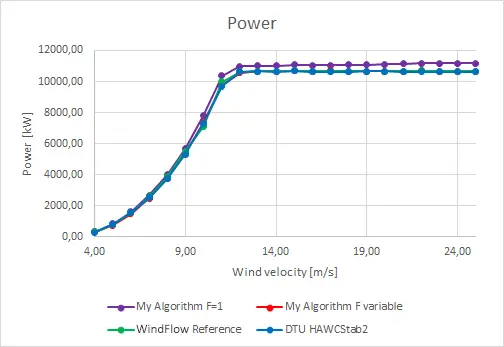
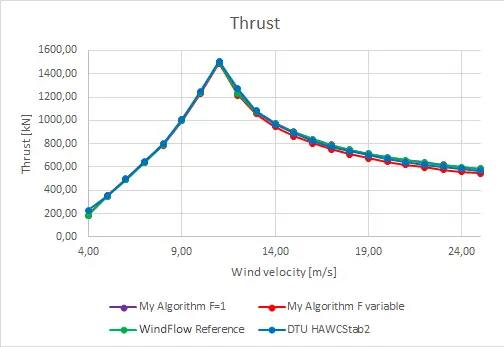
Comparison of obtained power values between working BEM code and referential data.
Optimization
The optimization of generated power makes sense only for wind values that are below rated velocity. Once the wind speed reaches this threshold, the power output does not need any improvement - on the contrary, it needs to be reduced as otherwise the wind turbine may be damaged. Therefore, the algorithm will be used only for wind values in the range 4 m/s - 11 m/s
The optimization algorithm is in a sense crude. It is based on constructing a Design of Experiments (DOE) like matrix, where power output is evaluated at combinations of design variables. It means that a multi-dimensional map of response is computed, where each dimension contains variation of one design variable. The map is then used to find maximum response, in our case power output, and corresponding set of design variables that lead to this response.
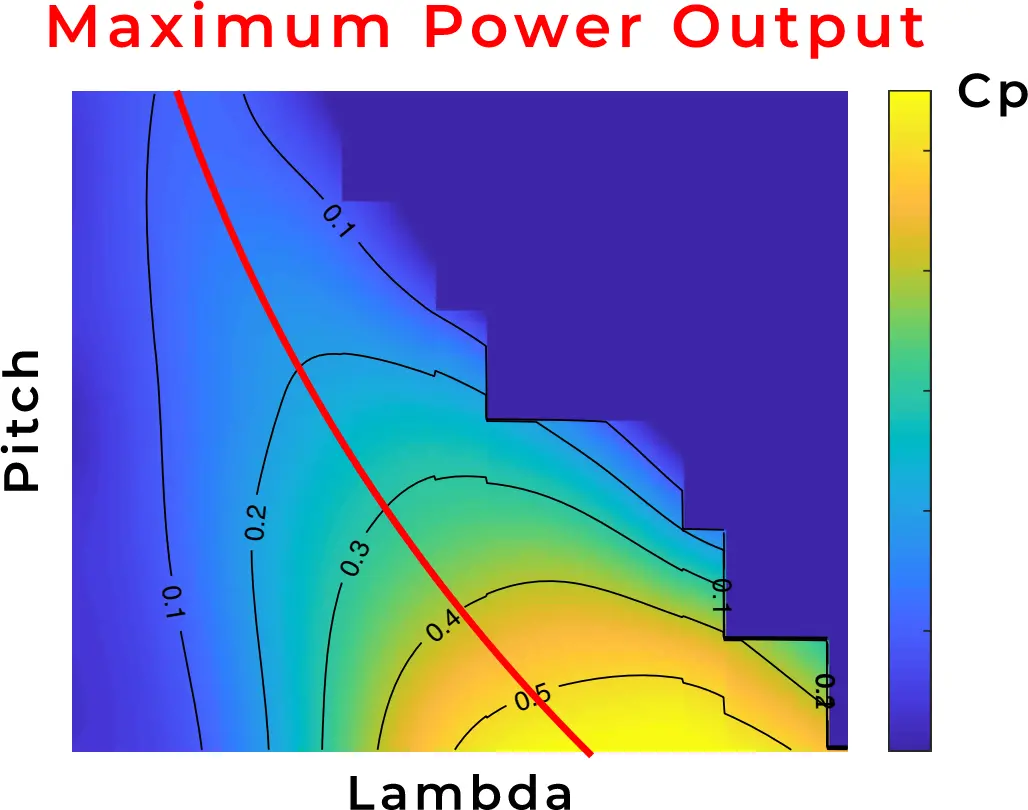
A generic pitch-lambda map with maximum power production curve.
Firstly, set of design variables has to be chosen. It is often the case that a wind turbine controller for pitch regulation operates based on pitch-lambda curve or map. We decided to use pitch and rotor speed as design variables, which are varied across wind speeds. The results are then used to construct the pitch-lambda map, where lambda is tip speed ratio. Another aspect that should be considered is which ranges of pitch angle and rotor velocity will be taken into consideration, and how big will be the increment between each iteration. While initially a very big range had been taken into consideration it turned out that the vast majority of points were not suitable for wind energy extraction, or were significantly sub-optimal with regards to the baseline parameters. Therefore since the pitch and Ω (rotor speed) baseline values had already been established it makes sense to take into consideration only a limited region in the vicinity of those points. The tested region is therefore < pitch - 2° ; pitch + 2°> and < Ω - 1rpm ; Ω + 1rpm>. The choice of the increment turned out to be quite problematic, because smaller increments meant better accuracy, but it also meant significantly increased computation time. There were also technical limitations to the actual accuracy of the wind turbine pitch control systems that had to be taken into account. Finally the increment was set to the values of Δpitch = 0.001° and ΔΩ = 0.01 rpm.
Results
The algorithm provided very interesting results that can be used as an input for the wind turbine controller system managing the turbine behaviour. For lower wind speeds it managed to optimize the power gain significantly, for example extra 60 kW generated for V = 5 m/s. However for wind speeds that are closer to the rated speed, very little extra power was generated. Fortunately, this is not very problematic in this case, because the wind turbine that is the test case for this work would not be operating at rated speed very often anyway. The reason for this is that the average wind speed for Hel is 7 m/s and for most of the time the turbine will operate in the conditions for which the algorithm enhanced significantly the power output.
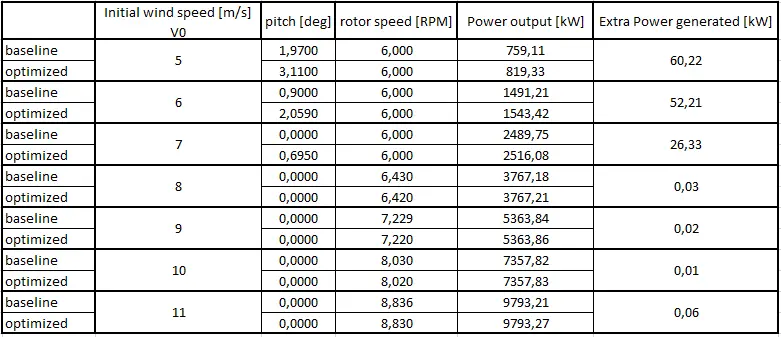
The results of optimization together with baseline values for comparison for sub-rated wind speeds.
This database can now serve as a set of instructions for a controller that will influence the behaviour of the turbine in a way that the power output will be optimized. Knowing the improved power output values one can calculate the total AEP of this wind turbine for Hel, and its AEP gain with regard to the baseline, pre-optimization value. For this purpose the same Weibull Curve will be used as it was for the baseline AEP calculations. Therefore it can be calculated that the annual power gain due to the optimization is 129.924 MWh, which is a significant amount of energy produced annually by a single wind turbine. This means that AEP has improved by 0.3558%.
[1] Przewoźny J., Performance analysis and optimization of wind turbine behaviour for various wind conditions using the Blade Element Momentum Method. Diploma Thesis, Lodz University Of Technology, Faculty Of Mechanical Engineering. Przewoźny J. - Thesis.